24/7 AI Trade Monitoring: How Automated Crypto Monitoring Works

Most signal providers ghost you after the entry alert. ChartsTrack monitors your entire trade lifecycle with continuous AI re-evaluation, dual timeframe analysis, dynamic confidence scoring, and real-time Telegram alerts that keep you informed from entry to exit.

Overview

The Complete Monitor Dashboard

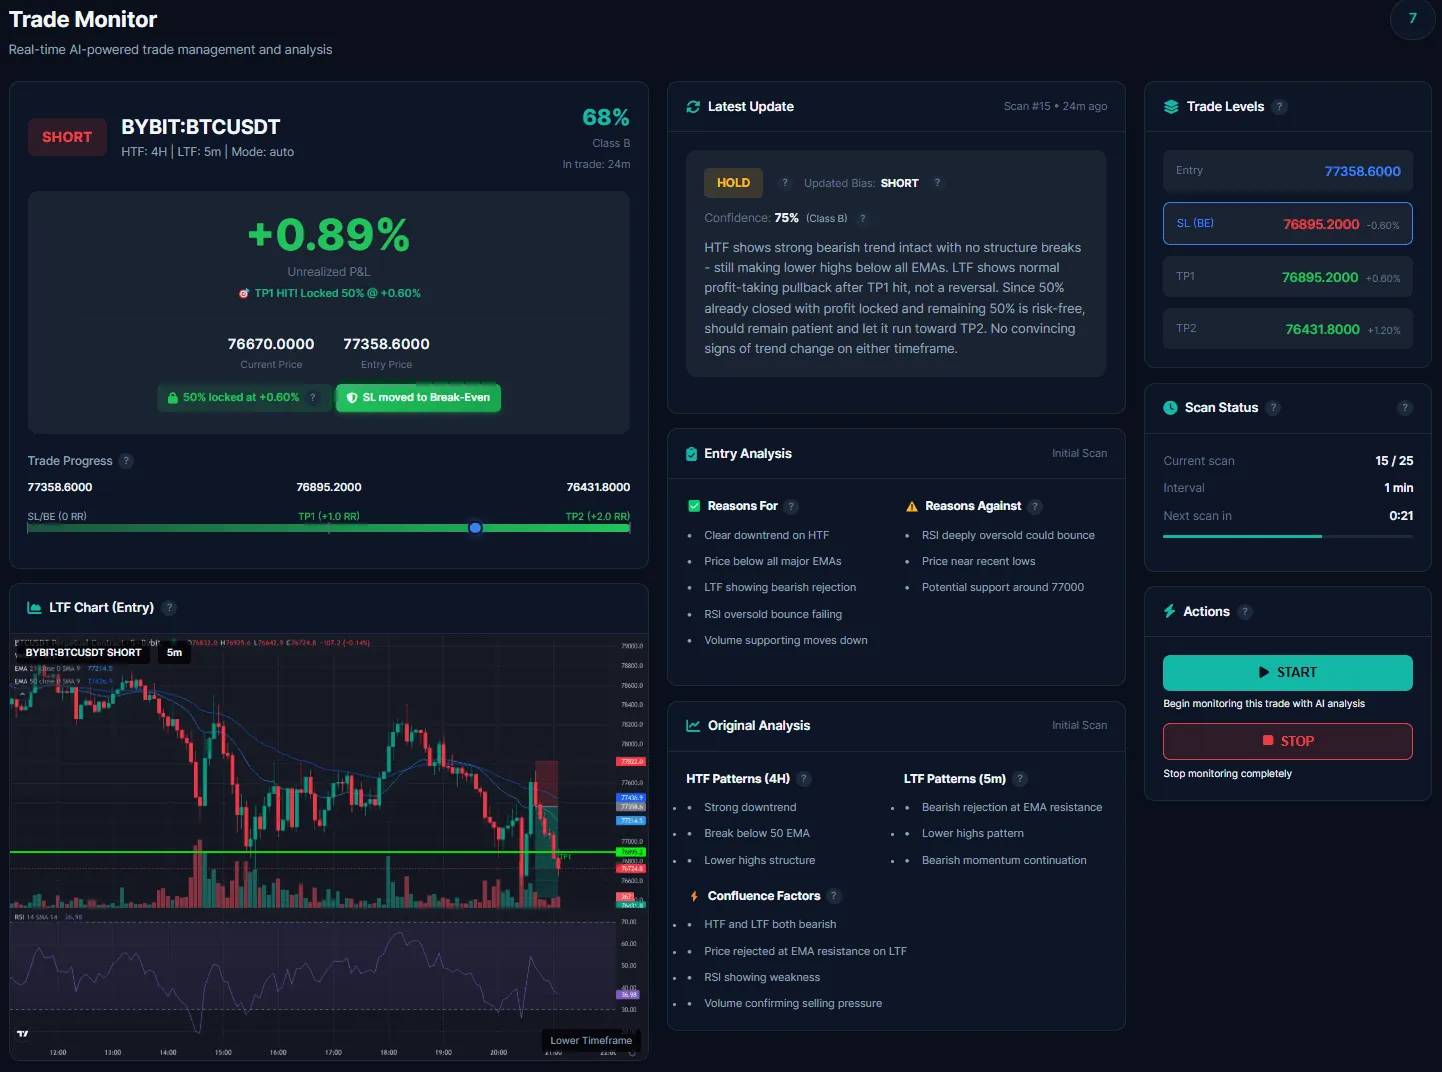
The moment your trade goes live, ChartsTrack's automated crypto monitoring system activates a comprehensive dashboard that becomes your command center for the entire duration of the trade. This is not a simple price alert system. It is a full AI-powered trade management interface that continuously evaluates your position against evolving market conditions.

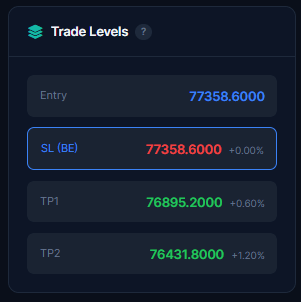
The monitor dashboard consolidates everything you need to manage an active trade into a single view. You can see your live charts with trade levels drawn directly on them, the latest AI analysis explaining what is happening right now, your current profit and loss updated with every scan, and the confidence meter showing how strongly the AI still supports the original trade thesis.

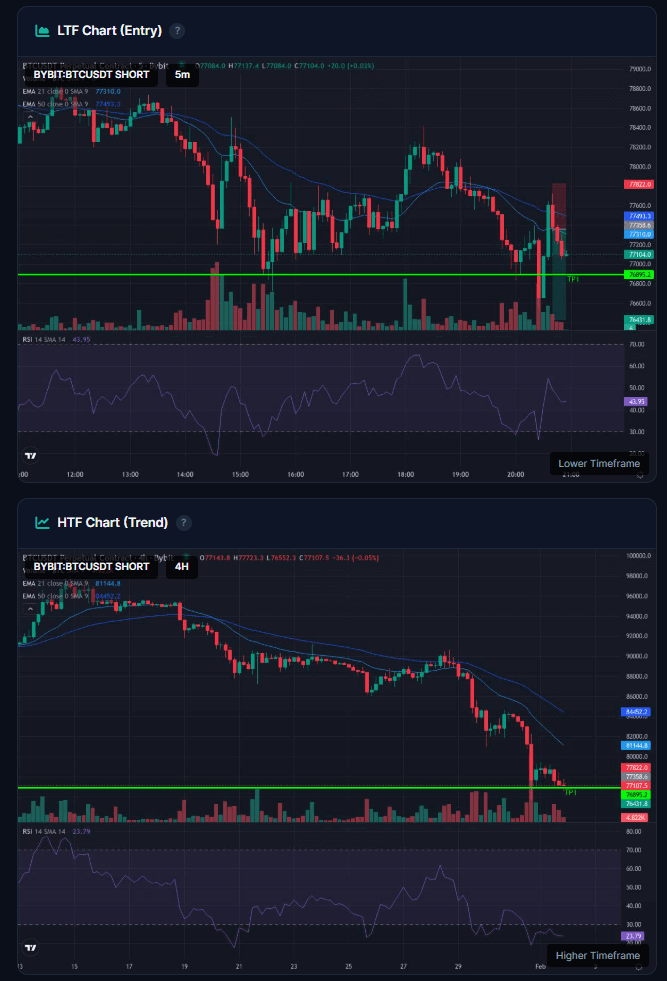
  • Live dual timeframe charts — HTF and LTF updated every scan with trade levels overlaid
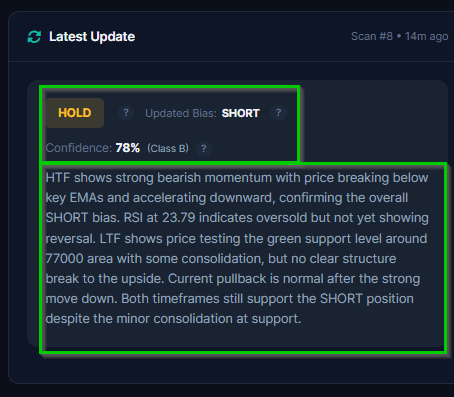
  • Real-time AI analysis — fresh interpretation of market conditions at every interval
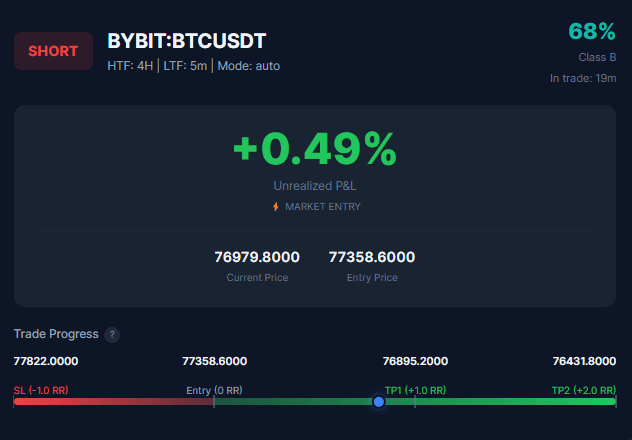
  • P&L tracking — live profit and loss percentage calculated from your entry price
  • Confidence meter — dynamic score reflecting the AI's current conviction in the trade
  • Trade progress bar — visual indicator showing position between stop-loss and TP2

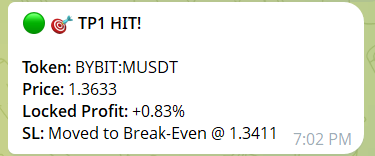
Everything runs automatically in the background. You do not need to keep the dashboard open for monitoring to continue. The AI captures fresh charts, re-analyzes the trade, and sends you Telegram alerts whenever something significant changes, whether you are at your desk or away from your screen.

ChartsTrack full trade monitor dashboard showing live charts, AI analysis, and trade levels
Dual Analysis

Dual Timeframe Charts: HTF and LTF Simultaneous Analysis

Single-timeframe analysis is one of the most common weaknesses in crypto trade monitoring. A trade can look perfectly healthy on a 5-minute chart while a massive bearish structure break is forming on the 4-hour timeframe. By the time you notice the higher timeframe deterioration, the damage to your position may already be significant.

ChartsTrack eliminates this blind spot by monitoring both higher timeframe and lower timeframe charts simultaneously during every scan cycle. The higher timeframe chart, typically the 4-hour, tracks the overall trend direction, major support and resistance zones, and structural integrity. The lower timeframe chart, typically the 5-minute, monitors precise price action around your entry level, short-term momentum shifts, and early warning signs of directional changes.

During each automated monitoring scan, both charts are freshly captured from TradingView with your trade levels (entry, stop-loss, TP1, TP2) drawn directly on the charts. The AI analyzes both timeframes together, looking for alignment or divergence between what the HTF structure suggests and what the LTF price action is actually doing.

  • HTF (4H) — Overall trend, structural support and resistance, major pattern formations
  • LTF (5m) — Precise momentum, entry-level price action, early reversal signals
  • Cross-timeframe alignment — AI flags when HTF and LTF tell different stories
Dual timeframe charts showing HTF 4-hour and LTF 5-minute analysis with live trade levels
AI Updates

Live AI Updates: Fresh Analysis Every Scan Interval

Every time the monitor runs a scan, the AI performs a complete re-evaluation of your trade. This is not a simple "price above or below entry" check. The AI examines the full market context on both timeframes and produces a detailed written analysis explaining exactly what it sees and what it recommends.

Each latest update includes a clear recommendation: HOLD if the trade thesis remains intact and price action is cooperating, MOVE_SL if conditions suggest tightening your stop-loss to protect gains, or EXIT if the original setup has been invalidated and continuing the trade carries unnecessary risk. Every recommendation comes with reasoning that explains precisely what changed and why the AI arrived at that conclusion.

This continuous re-evaluation is what separates automated crypto monitoring from static price alerts. Price alerts only trigger on specific levels. The AI monitor understands context. It can recognize when a trade is technically above your entry but the structure supporting it has deteriorated, or when a trade is temporarily underwater but the higher timeframe setup remains perfectly valid and patience is warranted.

  • Plain language analysis — no jargon-heavy reports, clear explanations of what matters
  • Actionable recommendations — HOLD, MOVE_SL, or EXIT with specific reasoning
  • Full scan history — review how AI assessment evolved throughout the trade
Latest AI monitoring update showing detailed trade analysis with HOLD recommendation and reasoning
Live Tracking

Dynamic Confidence Scoring and Trade Progress

Every trade begins with an initial confidence score based on the strength of the setup, typically ranging from 65% to 95% depending on the number of confluences and the clarity of the chart structure. But here is what makes ChartsTrack's 24/7 trade monitor fundamentally different from signal services: that confidence score updates dynamically with every monitoring scan as market conditions evolve.

You can watch the AI's conviction change in real time. A confidence score that starts at 85% might climb to 92% as the trade works in your favor and the chart structure strengthens. Or it might drop to 68% as concerns emerge and price action deviates from expectations. When confidence drops below a critical threshold, you receive an immediate Telegram alert so you can reassess your position.

Alongside the confidence meter, the trade progress bar gives you an instant visual snapshot of where your position sits between your stop-loss and TP2. The live P&L percentage shows your exact profit or loss based on the current market price, updated at every scan interval. Together, these metrics give you a comprehensive real-time picture of trade health without needing to open TradingView or your exchange.

  • Confidence meter — live percentage reflecting AI conviction, updated every scan
  • Live P&L — real-time profit and loss tracking from your entry price
  • Progress bar — visual position between stop-loss and TP2 target
  • Threshold alerts — automatic Telegram notification when confidence drops significantly
Trade progress bar with live P&L percentage and dynamic confidence meter
Trade Levels

Trade Levels and Scan Status: Full Visibility

The trade levels card displays all your critical price levels in one clean view: entry price, current stop-loss position, TP1 target, and TP2 target. When the AI recommends moving your stop-loss (for example, to breakeven after TP1 is hit), the card updates immediately and shows a "moved" indicator next to the adjusted level so you always know exactly where your protection sits.

The scan status card shows you the operational state of your monitor: how many scans have been completed, how many remain in your current credit allocation, when the next scan is scheduled, and the current scan interval setting. This transparency ensures you always know exactly what the automated monitoring system is doing and when the next AI re-evaluation will occur.

  • Entry price — your original entry level with current distance in percentage
  • Stop-loss — current SL position with moved indicator when adjusted
  • TP1 and TP2 — both take-profit targets with hit status indicators
  • Next scan countdown — time until the next automated AI re-evaluation
  • Scan counter — completed scans and remaining allocation
Trade levels card showing entry, stop-loss with moved indicator, TP1, and TP2 targets

Multi-TP Management: The 50/50 Profit-Locking Strategy

ChartsTrack's automated crypto monitoring system uses a structured multi-target profit management approach designed to balance profit-taking with letting winners run. Every trade setup includes two take-profit levels, and the monitor manages the transition between them automatically.

When TP1 is reached, 50% of the position is closed at profit. This is the conservative target, typically set at a 1:1 risk-reward ratio relative to your stop-loss distance. By banking half of your position at TP1, you lock in guaranteed profit on the trade regardless of what happens next. The monitor records this partial close and calculates your locked P&L accordingly.

After TP1, the stop-loss moves to breakeven for the remaining 50%. This is where the locked profit system becomes powerful. The remaining half of your position continues riding toward TP2 with absolutely zero downside risk. If price reverses and hits your now-breakeven stop-loss, you still walk away with the profit from the TP1 partial close. If price continues to TP2, you capture the full extended move on the remaining position.

This 50/50 take-profit management strategy is one of the most effective approaches in crypto trading because it addresses the two biggest emotional challenges traders face: the urge to close too early (solved by banking profits at TP1) and the fear of giving back gains (solved by moving the stop to breakeven). The automated monitoring system handles both transitions mechanically, removing emotion from the equation entirely.

RR-Level Trailing Stop: Progressive Profit Protection

After TP1 is hit, the monitor activates an intelligent trailing stop system based on risk-reward levels. Rather than using a fixed trailing distance that can be too tight or too loose, the system dynamically calculates RR levels (1R, 1.5R, 2R, etc.) relative to your original stop-loss distance and progressively trails your stop-loss upward as price moves through each level. This means the further your trade runs past TP1, the more profit is locked in automatically. If price eventually reverses, you exit at the highest RR level reached, capturing significantly more than just the TP1 partial close.

  • TP1 hit — 50% position closed, profit locked, stop-loss moved to breakeven
  • TP2 hit — remaining 50% closed at extended target, full trade completed
  • Locked P&L — guaranteed profit calculated server-side including partial closes
  • Zero risk after TP1 — breakeven stop means the remaining position cannot lose
  • RR-level trailing — stop-loss progressively trails through 1R, 1.5R, 2R levels as price advances
Alerts

Real-Time Telegram Alerts for Every Critical Event

You cannot stare at a dashboard 24 hours a day, and you should not have to. ChartsTrack's Telegram integration delivers instant notifications for every critical event during your trade, ensuring you never miss an important development even when you are away from your computer or sleeping.

Telegram alerts are triggered by specific events, not arbitrary time intervals. You receive a notification precisely when something actionable happens: when TP1 is hit and profit is locked, when TP2 completes the trade, when a market structure break threatens your position, or when the AI's confidence drops below a critical threshold. Each alert includes the relevant context and numbers so you can make informed decisions immediately from your phone.

The structure break warnings deserve special attention because they represent one of the most valuable features of automated crypto monitoring. Traditional price alerts cannot detect structural changes. They only trigger at specific price levels. ChartsTrack's AI, however, can recognize when the market structure supporting your trade has fundamentally shifted, even if price has not yet reached your stop-loss. This early warning system often gives you the opportunity to exit at a better price than your stop-loss would, or at minimum to prepare mentally for a potential loss rather than being caught off guard.

  • TP1 hit alerts — confirmation with locked profit amount and updated stop-loss
  • TP2 hit alerts — full trade completion summary with final P&L
  • Structure break warnings — early detection of market shifts threatening your position
  • Confidence drop alerts — immediate notification when AI conviction falls significantly
  • Configurable in monitor settings — enable, disable, or customize alert types
Telegram alert showing TP1 hit notification with locked profit amount and updated stop-loss

Configurable Scan Intervals: 1 Minute to 4 Hours

Every trader operates differently. Scalpers need rapid 1-minute scan intervals to catch micro-structure changes. Swing traders prefer 1-hour or even 4-hour intervals to avoid noise and focus on meaningful movements. ChartsTrack's monitor settings let you configure the exact scan frequency that matches your trading style and timeframe. The default interval is 5 minutes, which provides a balanced approach for most crypto trading scenarios. You can adjust this setting at any time during an active trade without interrupting the monitoring session, giving you full control over how frequently the AI re-evaluates your position.

Additionally, the lower timeframe chart interval adjusts dynamically based on how long your trade has been running. Fresh trades use short LTF intervals (as low as 1 minute) for maximum precision during the critical early phase. As the trade matures over hours and days, the LTF interval automatically scales up to 15 minutes, 1 hour, or even 4 hours, reducing noise and focusing on meaningful structural changes rather than micro-fluctuations.

Built-In Safety Systems: Preventing Premature and Impulsive Exits

ChartsTrack's monitoring engine includes multiple safety mechanisms designed to prevent the AI from making impulsive exit decisions, exactly the same way a disciplined human trader would avoid acting on a single red candle or a momentary dip in confidence.

Two-Scan Close Confirmation

When the AI first determines that a trade should be closed, it does not execute immediately. Instead, the first EXIT recommendation is converted to a HOLD with a pending close flag. The AI must confirm the exit recommendation on the very next scan before the trade is actually marked for closure. This two-scan confirmation system prevents the AI from reacting to temporary spikes, flash wicks, or single-candle noise that reverses within minutes. Only sustained deterioration across two consecutive scans triggers an actual close signal.

50% Early Exit Protection

The system physically prevents the AI from recommending a full trade close before price has moved at least 50% of the distance toward either your stop-loss or TP1. During the early phase of a trade, when price is still near the entry level and has not yet shown its hand, premature exits are the most common source of missed winners. This hard-coded protection ensures every trade gets a fair chance to develop before the AI can pull the plug.

Real-Time Price Detection: 4 WebSocket Feeds

TP and SL hits are not detected by periodic scanning alone. ChartsTrack connects to four simultaneous WebSocket price streams — Binance Spot, Binance Futures, Bybit Spot, and Bybit Linear — providing sub-second price detection for your trade levels. The moment price touches your TP1, TP2, or stop-loss on any of these feeds, the system records the event instantly and sends you a Telegram alert, regardless of when the next AI scan is scheduled.

Frequently Asked Questions About AI Trade Monitoring

Everything you need to know about ChartsTrack's 24/7 automated crypto trade monitoring system.

How often does the AI monitor scan my trade?

You can configure the scan interval from as frequent as every 1 minute to as relaxed as every 4 hours. The default scan interval is 5 minutes. Each scan captures fresh TradingView charts on both higher and lower timeframes, and the AI re-analyzes the full trade context including price action, structure, momentum, and proximity to your trade levels. The lower timeframe chart interval also adjusts dynamically based on trade duration — fresh trades use shorter intervals for precision, while mature trades scale up to reduce noise. You can change the scan interval at any time during an active monitoring session.

What happens when TP1 is hit during monitoring?

When price reaches your TP1 level, the monitor automatically records that 50% of your position should be closed at profit. The stop-loss is then moved to breakeven for the remaining 50% position, effectively locking in profit and eliminating downside risk. After TP1, an RR-level trailing stop activates, progressively advancing your stop-loss through risk-reward levels (1R, 1.5R, 2R) as price continues in your favor. You receive a Telegram alert confirming the TP1 hit with your locked profit amount, and monitoring continues for the remaining position targeting TP2.

Can I monitor trades I entered manually?

Yes. ChartsTrack offers a Manual Monitor feature where you can input your own trade details including entry price, stop-loss, TP1, TP2, and bias direction. The AI will then monitor your manually entered trade with the same dual timeframe analysis, confidence scoring, and Telegram alerts as AI-generated setups.

What does the AI do if confidence drops significantly?

When the AI detects that the original trade thesis is deteriorating, it adjusts the confidence score downward and changes its recommendation. This can range from HOLD with caution to MOVE_SL (tighten your stop) to EXIT (close the position). You receive a Telegram alert for significant confidence drops, and the latest update section explains exactly what changed and why the AI is concerned about the trade's viability.

Related Articles

Explore more about ChartsTrack's AI-powered crypto trading tools and alert systems.

Start Monitoring Your Trades with AI

Experience 24/7 automated crypto monitoring with dual timeframe analysis, confidence scoring, and real-time Telegram alerts. Start free with 2 credits.