Already have your own trade setups? You do not need to give that up. Enter your own Entry, Stop-Loss, and Take-Profit levels and let ChartsTrack's AI monitor your position 24/7 with the same powerful analysis engine used for AI-generated trades.
Not every trader wants an AI to generate their trade setups. Many experienced traders have their own analysis methods, follow specific signal providers, or test proprietary strategies that they trust. The problem is not finding trade ideas — it is the exhausting process of monitoring those trades around the clock.
That is exactly why ChartsTrack built the Manual Trade Monitor. You bring the setup — entry price, stop-loss, take-profit targets, bias direction — and the AI brings 24/7 monitoring with dual timeframe analysis, dynamic confidence scoring, structure break detection, and real-time Telegram alerts. It is the best of both worlds: your trading intelligence combined with AI-powered trade management.
The manual trade monitor uses the exact same monitoring engine as AI-generated trades. Every scan captures fresh charts on both timeframes, runs comprehensive technical analysis, and provides updated HOLD, EXIT, or MOVE_SL recommendations. The only difference is who created the original setup — everything after that is identical. Your trades get the same first-class monitoring treatment regardless of their source.
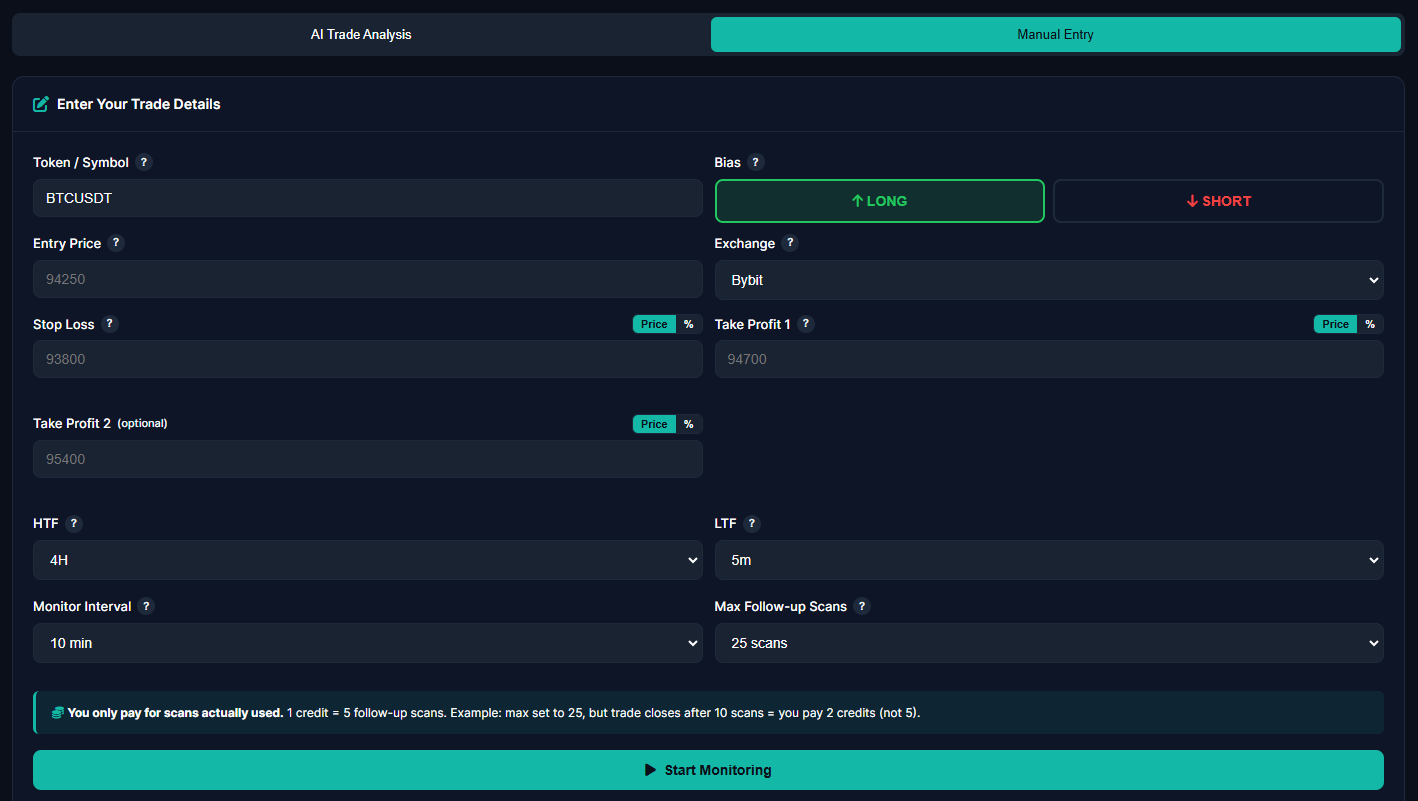
Setting up a manual trade monitor is straightforward. The entry form collects everything the AI needs to begin monitoring your position. Each field maps directly to the trade parameters you already know from your own analysis.
You specify the Token (such as BTCUSDT or ETHUSDT), select your Bias (LONG or SHORT), enter your Entry price, Stop-Loss level, and both TP1 and TP2 targets. You also select the HTF and LTF timeframes that the AI should monitor — matching the timeframes you used for your analysis produces the best results.
Once you activate monitoring on your manual trade, you get access to the exact same full-featured dashboard that AI-generated trades use. There is no reduced functionality, no "lite" version — manual trades are treated as first-class citizens in the monitoring system.
The dashboard displays dual timeframe charts with your trade levels overlaid, a live P&L tracker that updates with each scan, the confidence score meter showing the AI's evolving conviction in your trade, and the complete analysis history showing every scan result since monitoring began.
This is where the manual trade monitor truly shines. Even though you created the trade setup yourself, the AI provides fresh, independent technical analysis with every monitoring scan. It does not just track price — it evaluates the entire technical picture and gives you an objective second opinion.
Each scan produces a detailed update that includes the current market structure assessment, momentum analysis across both timeframes, identification of any new support or resistance levels that have formed, and a clear recommendation: HOLD (trade thesis intact), EXIT (conditions have deteriorated), or MOVE_SL (tighten your stop to lock profit).
Think of it as having a professional analyst reviewing your trade every 5 minutes and giving you their honest assessment. If your trade is working, the AI confirms it. If conditions are changing, the AI warns you. This continuous feedback loop is invaluable for learning from your own setups and understanding what the market is doing beyond your initial analysis.
The manual trade monitor fits into several common trading workflows. Understanding when to use it versus the AI chart analysis helps you get the most value from both features.
You spotted a beautiful head and shoulders pattern on the 4H BTC chart, identified your entry at the neckline break, and placed your stop-loss above the right shoulder. Your analysis is solid, but you cannot watch the trade for the next 48 hours. Enter your levels in the manual monitor and let the AI keep watch. You get Telegram alerts if anything changes.
You follow a trader on social media who calls entries, or you subscribe to a signal group that provides trade setups. Instead of blindly trusting those signals, input the levels into ChartsTrack's manual monitor and get an AI second opinion. The monitoring AI will objectively assess whether the setup is working as intended and alert you if conditions deteriorate.
Sometimes you have a trade idea but are not fully confident. Enter it as a manual monitor and see what the AI thinks. The confidence score and detailed analysis will either validate your thesis or highlight concerns you may have missed. This is particularly useful for learning — comparing your analysis with the AI's assessment teaches you to see things you might otherwise overlook.
If you are developing or testing a new trading strategy, the manual monitor gives you a structured way to track results. Every trade is saved to your history with full statistics including P&L, duration, entry/exit details, and whether each TP was hit. Over time, you build a comprehensive journal of your strategy's performance that helps you identify strengths and weaknesses. Understanding risk management fundamentals becomes much easier when you have concrete data from your own trades.
Every manual trade you monitor is permanently saved to your trade history with complete statistics. This is not just a log — it is a comprehensive trade journal that calculates your performance metrics automatically.
The history dashboard shows your total P&L, number of trades, win rate, profit factor, average trade duration, average P&L per trade, and your best and worst trades. You can filter by time period, result (win/loss), exit type (TP1/TP2/SL), and critically — by source (AI or Manual).
The source filter is especially powerful. It lets you directly compare the performance of your own manual setups versus AI-generated trades. Are your entries better but your exits worse? Is your win rate higher on manual trades but with smaller average wins? These insights are gold for improving your trading over time.
Manual Monitor uses the same AI analysis engine as our automated chart analysis scans — the same intelligence, the same dual timeframe monitoring, the same confidence scoring, the same Telegram alerts. The only difference is who created the trade setup. Whether the entry came from AI or from your own analysis, the monitoring is identical. Your trades deserve the same level of oversight regardless of their source.
Both features serve different needs. Here is when each one is the right choice.
| Feature | AI Chart Analysis | Manual Monitor |
|---|---|---|
| Trade setup created by | AI analyzes your chart | You enter your own levels |
| Entry, SL, TP levels | AI-generated | User-defined |
| 24/7 AI monitoring | Full monitoring | Full monitoring |
| Dual timeframe charts | HTF + LTF | HTF + LTF |
| Confidence scoring | Dynamic updates | Dynamic updates |
| Telegram alerts | All 7 types | All 7 types |
| Trade history | Tagged as "AI" | Tagged as "Manual" |
| Best for | Discovering new setups | Monitoring your own ideas |
The two features complement each other perfectly. Use AI Chart Analysis when you want the AI to find and generate trade setups from your TradingView charts. Use Manual Monitor when you already have a setup from your own analysis or another source and want AI-powered monitoring and a second opinion. Many traders use both: they let the AI generate setups on some pairs while manually monitoring their own ideas on others.
Enter your own Entry, SL, TP1, and TP2 levels from any source. The AI takes over monitoring with continuous re-evaluation, structure break detection, and dynamic confidence scoring on your position.
Get the complete monitoring dashboard with dual timeframe charts, live P&L tracking, confidence meter, latest AI analysis, and scan history. No reduced features — identical to AI trades.
Every manual trade is saved with full statistics. Filter by source to compare your manual setups against AI-generated trades. Build a comprehensive trading journal automatically.
AI Chart Analysis generates the trade setup for you by analyzing your TradingView charts and providing entry, SL, and TP levels. Manual Monitor lets you input your OWN levels from any source — your own analysis, signals from another provider, or a strategy you are testing. Once monitoring starts, both modes use the exact same AI monitoring engine with identical features: dual timeframe analysis, confidence scoring, structure break detection, and Telegram alerts.
Yes. The monitoring AI treats manual trades and AI-generated trades identically. Every scan captures both HTF and LTF charts, runs full technical analysis, updates the confidence score, and provides HOLD/EXIT/MOVE_SL recommendations. The only difference is the trade source label in your history — manual trades are tagged as "Manual" while AI-generated trades are tagged as "AI".
Absolutely. If you receive a trade setup from another signal provider, a trading community, or your own analysis, you can enter those exact levels into the Manual Monitor and get full AI-powered monitoring. This is a great way to get a second AI opinion on setups from other sources and to track your results with detailed statistics in your trade history.
Bring your trade setups. We bring the 24/7 AI monitoring, dual timeframe analysis, and instant Telegram alerts.