AI Chart Analysis: Complete Setup Guide From TradingView

Learn how ChartsTrack's AI trading tool automatically captures TradingView charts, analyzes multi-timeframe confluence, and delivers complete crypto trade setups with precise entry, stop-loss, and take-profit levels in seconds.

Step 1

Automatic Chart Capture from TradingView

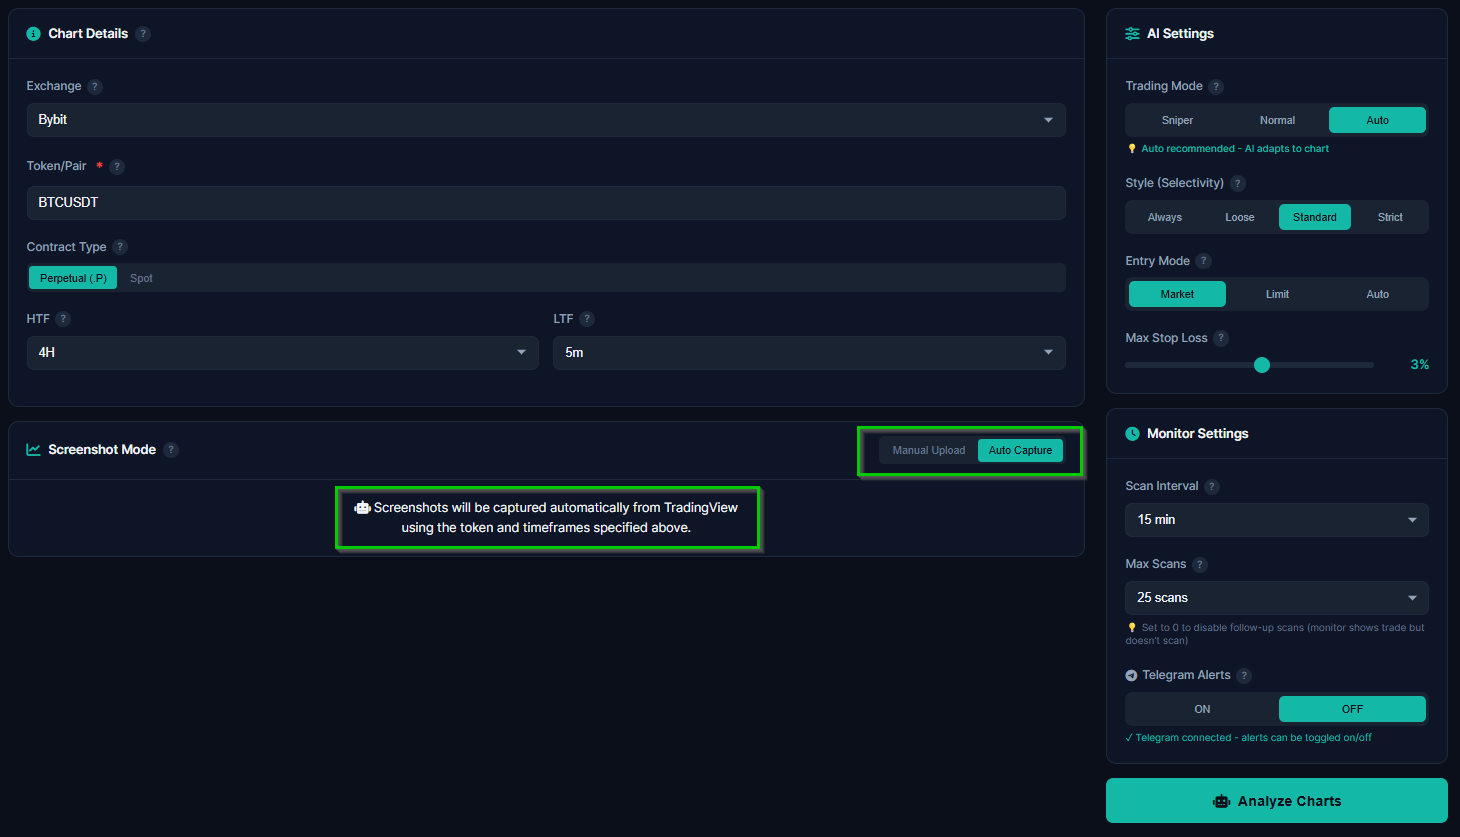
The days of manually screenshotting your TradingView charts and uploading them to yet another platform are over. ChartsTrack's automated chart analysis system captures your charts directly from TradingView in the background, completely hands-free.

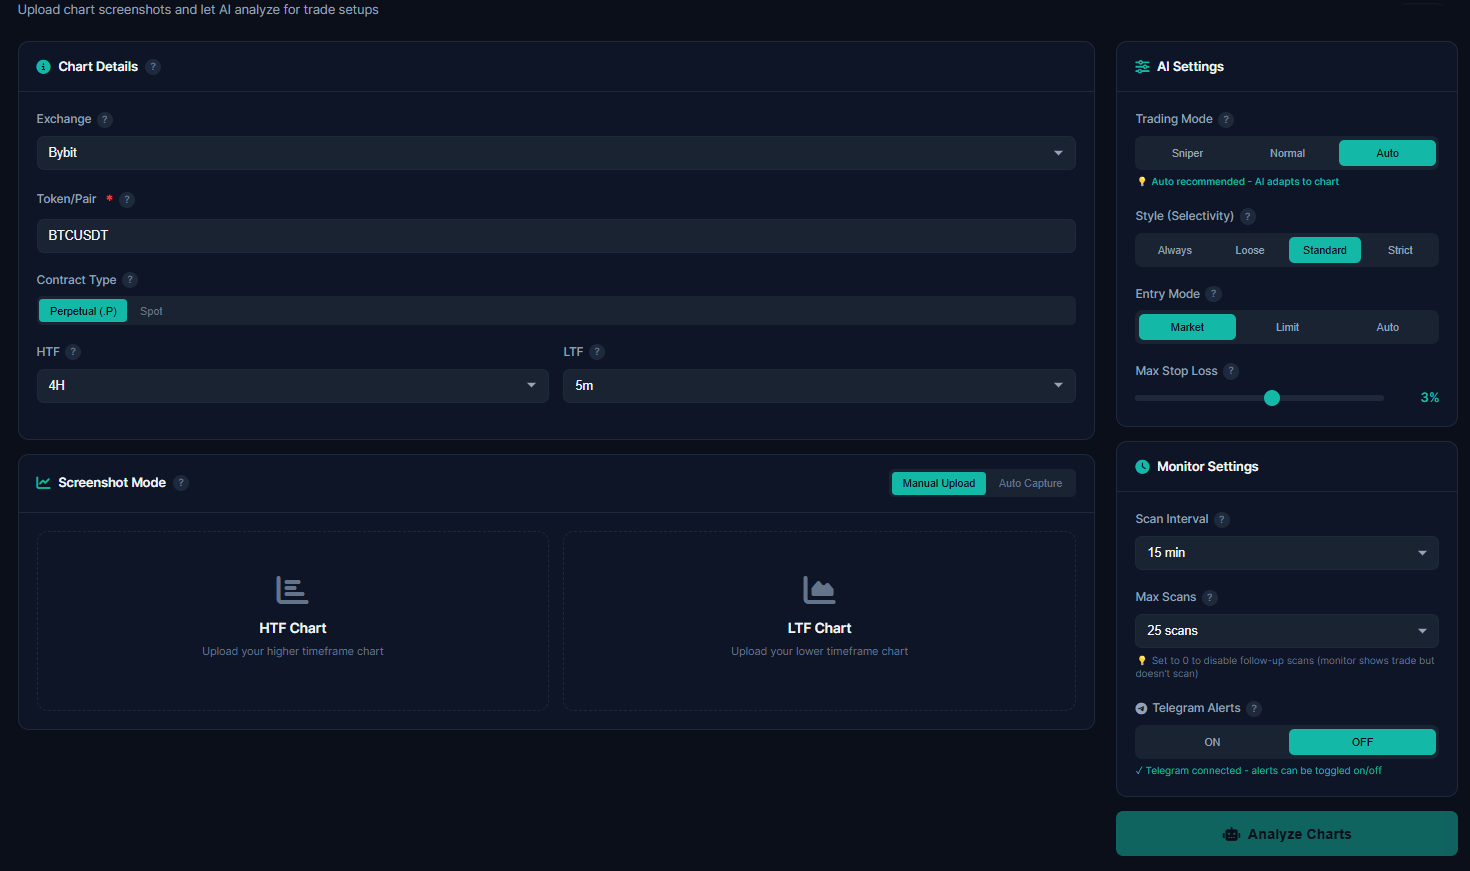
Simply select your exchange (Bybit or Binance), enter the token pair you want to analyze (such as BTCUSDT, ETHUSDT, or any supported cryptocurrency), and choose your contract type (Perpetual or Spot). The moment you hit analyze, the system automatically fetches both higher timeframe and lower timeframe charts from TradingView without any manual intervention on your part.

  • No manual screenshots needed — charts captured automatically from TradingView
  • Dual timeframe capture — both HTF (4H) and LTF (5m) fetched simultaneously
  • Works with any crypto pair — BTCUSDT, ETHUSDT, altcoins, and more
  • Exchange-specific charts — accurate price data from Bybit or Binance

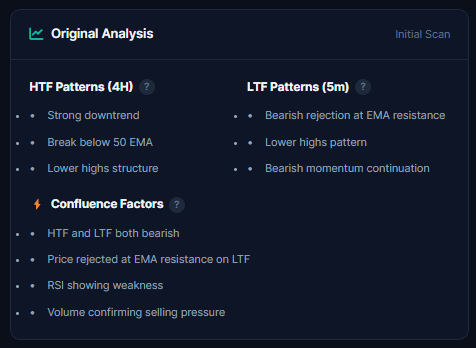
Every auto-captured chart includes EMA 21, EMA 50, RSI 14, and Volume overlays applied automatically. These technical indicators give the AI additional data points for trend confirmation (EMA crossovers), momentum analysis (RSI divergence and overbought/oversold conditions), and volume validation of price movements. You do not need to configure these indicators yourself — they are applied to every chart capture by default.

This automated chart analysis approach eliminates human error in chart preparation and ensures the AI always receives clean, properly formatted TradingView charts with consistent technical indicators for accurate pattern recognition and confluence analysis.

TradingView auto-capture showing automatic chart screenshot for AI analysis
Alternative

Manual Upload for Custom TradingView Screenshots

While auto-capture handles most use cases perfectly, some traders prefer to upload their own TradingView screenshots. Perhaps you have custom indicators drawn on your chart, specific annotations you want the AI to consider, or you are analyzing a chart from a timeframe combination that differs from the default setup.

The manual upload interface accepts standard image files directly from your TradingView workspace. Simply take a screenshot of your chart with whatever drawings, indicators, or annotations you have applied, and drag it into the upload area. The AI will incorporate everything visible on your chart into its analysis, including any trendlines, support and resistance zones, or pattern markings you have manually drawn.

  • Custom indicator support — AI reads your personal chart annotations
  • Flexible timeframes — upload any timeframe combination you prefer
  • Drag and drop — simple upload interface for quick analysis

Whether you use auto-capture or manual upload, the AI chart analysis engine processes both methods identically, delivering the same depth of multi-timeframe pattern recognition and confluence scoring regardless of how the chart data reaches the system.

ChartsTrack manual chart upload interface for TradingView screenshots
Configuration

AI Settings: Trading Mode, Style, and Selectivity

Before running your automated chart analysis, you configure three critical AI settings that determine how the system interprets chart patterns and generates trade setups. These settings let you tailor the AI to match your personal trading style and risk tolerance.

Trading Mode

The trading mode controls how aggressive or conservative your stop-loss placement will be. This is one of the most important decisions you make before each analysis:

  • Sniper Mode (1% SL) — Extremely tight stop-loss for precision entries. Best for experienced traders who want maximum risk-reward ratios and are comfortable with tighter invalidation levels. Higher chance of being stopped out, but significantly better reward when the trade works.
  • Normal Mode (3% SL) — Balanced stop-loss that gives your trade room to breathe through normal market volatility. The recommended starting point for most traders, especially in the notoriously volatile crypto market.
  • Auto Mode — Let the AI decide. Based on current market conditions, volatility readings, and the strength of the identified setup, the AI selects whichever mode produces the optimal risk-reward profile for that specific chart.

Selectivity Slider

The selectivity slider determines how many confluences the AI requires before presenting a trade setup. This directly controls the quality filter applied to your automated chart analysis:

  • Always — The AI will attempt to find a setup in virtually any chart condition. Highest number of setups, but includes lower-probability trades.
  • Loose — Requires basic confluence between timeframes. Filters out the weakest setups while still providing frequent opportunities.
  • Standard — Balanced filtering that requires solid multi-timeframe confluence. The recommended default for consistent results.
  • Strict — Two or more strong confluences required. Fewest setups, but highest probability when the AI does identify a trade.
AI settings panel showing Sniper and Normal trading modes with selectivity slider
Analysis Result

The Complete Trade Setup: Patterns, Confluence, and Levels

When the AI finishes analyzing your TradingView charts, you receive a comprehensive trade setup that goes far beyond a simple "buy" or "sell" signal. The analysis result is a detailed breakdown of everything the AI found across both timeframes, giving you full transparency into why a specific trade makes sense.

The complete crypto trade setup includes precise price levels and a thorough reasoning chain that explains the logic behind every number:

  • Entry Price — The optimal entry point based on multi-timeframe confluence and current price action structure
  • Stop-Loss — Calculated based on your selected trading mode (1% for Sniper, 3% for Normal) placed below the nearest structural invalidation
  • TP1 and TP2 — Two take-profit targets. TP1 is the conservative target for partial profit-taking, TP2 is the extended target for the remaining position
  • HTF Patterns — Higher timeframe structural analysis including trend direction, key levels, and market structure
  • LTF Patterns — Lower timeframe entry confirmation with precise candlestick patterns and momentum analysis
  • Confluence Score — How many independent signals align to support this specific trade setup

Every element of the analysis is laid out transparently so you can verify the AI's reasoning against your own chart reading. This is not a black box signal service. You see exactly what patterns the AI detected, which support and resistance levels it identified, and how it arrived at each price target.

Complete AI trade setup showing HTF and LTF pattern analysis with confluence scoring

How Credits Work: Fair Pricing for AI Chart Analysis

ChartsTrack uses a credit-based system designed to be transparent and fair. Unlike subscription services that charge you monthly regardless of usage, you only pay for actual analysis results. Here is exactly how the credit system works for automated chart analysis:

One credit gives you up to 5 scan attempts on a single chart. When you submit a chart for analysis, the AI examines the current market conditions and looks for valid trade setups. Sometimes, especially on charts with unclear structure or during low-volatility consolidation periods, the AI may determine that no high-probability trade exists on that chart. In this case, you receive a "No Trade" result with an explanation of why, and no credit is charged.

This approach means you are never penalized for market conditions that do not present valid opportunities. The AI is designed to be honest about when it sees a setup and when it does not, and the credit system reflects that honesty. You only spend a credit when the AI successfully identifies a complete trade setup with entry, stop-loss, and take-profit levels.

  • 1 credit = up to 5 scan attempts on the same chart analysis
  • No trade found = no credit charged — you only pay for actual setups
  • New accounts start with 2 free credits — no credit card required
  • Credits never expire — use them whenever you are ready to trade

Start Free with 2 Credits

Every new ChartsTrack account receives 2 free credits immediately upon registration. No credit card required, no trial period, no strings attached. Use your free credits to run up to 2 complete AI chart analyses and see exactly what kind of trade setups the system generates for your favorite cryptocurrency pairs. If the AI finds no valid setup on your chart, those credits are preserved for your next analysis.

Frequently Asked Questions About AI Chart Analysis

Everything you need to know about using ChartsTrack's automated chart analysis tool for crypto trading.

How does TradingView auto-capture work with ChartsTrack?

ChartsTrack automatically captures your TradingView charts in the background when you start an analysis. You select your exchange, token pair, and contract type, and the system fetches both higher timeframe (HTF) and lower timeframe (LTF) charts directly from TradingView without any manual screenshots or uploads required. The entire process takes just a few seconds and ensures the AI always receives clean, properly formatted chart data for accurate pattern analysis.

What is the difference between Sniper and Normal trading modes?

Sniper mode uses a tight 1% stop-loss (calculated at 1.5x ATR) for precision entries with higher risk-reward ratios. It is ideal for experienced traders who want aggressive setups and are comfortable with tighter invalidation levels. Normal mode uses a more relaxed 3% stop-loss (2-2.5x ATR), giving trades more room to breathe through normal crypto market volatility. The ATR-based calculation ensures stop-losses adapt to each token's actual volatility. Auto mode lets the AI decide which mode fits the current chart conditions best, selecting the optimal risk-reward configuration dynamically.

Do I get charged a credit if the AI finds no trade setup?

No. Each credit gives you up to 5 scan attempts on a single chart. If the AI determines there is no valid trade setup after analyzing the chart, no credit is deducted. You only spend a credit when the AI successfully identifies a complete trade setup with entry, stop-loss, and take-profit levels. This ensures you are never penalized for honest market conditions where no high-probability opportunity exists.

What chart patterns and confluences does the AI detect?

The AI examines support and resistance zones, trendlines, candlestick patterns, order blocks, fair value gaps, market structure breaks (BOS/CHoCH), RSI 14 momentum, EMA 21 and EMA 50 moving averages, and volume analysis across both higher and lower timeframes. Every auto-captured chart includes these indicators by default. The AI looks for confluence between multiple independent signals before recommending a trade. The selectivity slider controls the minimum number of confluences required, letting you choose between more frequent setups and higher-probability-only trades.

Related Articles

Dive deeper into ChartsTrack's AI-powered crypto trading tools and strategies.

Try AI Chart Analysis Free

Get 2 free credits and experience automated TradingView chart analysis with complete trade setups. No credit card required.

📚 Related Resources

📝

Test Your Knowledge

Take our 50-question trading quiz and discover your skill level

🔍

Pattern Recognition

Learn how AI detects 20+ chart patterns automatically

🌍

Global Trading Sessions

Track when Asian, London, and NY markets are active