Support and resistance are the foundation of all technical analysis. Learn how these levels work, why they matter, and how AI detects them across multiple timeframes for higher-probability crypto trades.
If there is one concept that every crypto trader must understand before placing a single trade, it is support and resistance. These are not abstract academic ideas -- they are the real price levels where buying and selling pressure concentrate, where trends pause, reverse, or accelerate. Every candlestick pattern, every indicator signal, every chart formation ultimately comes back to the interplay between support and resistance.
Support is a price level where buying pressure is strong enough to prevent further decline. Think of it as a floor. When price drops to a support level, buyers step in because they perceive value, creating demand that absorbs the selling pressure and pushes price back up.
Resistance is the opposite -- a ceiling where selling pressure prevents further advance. When price rises to resistance, sellers take profits or open short positions, creating supply that overwhelms the buying pressure and pushes price back down.
Understanding where these levels sit on your chart is the difference between entering trades at optimal locations with tight stop losses and entering randomly with no structural edge. The challenge is that identifying them accurately requires analyzing multiple timeframes, recognizing patterns, and weighing historical significance. This is exactly where AI analysis provides a decisive advantage.
The higher timeframe (HTF) chart -- typically the 4-hour, daily, or weekly -- reveals the major support and resistance zones that matter most. These are the levels where institutional traders, whales, and large market participants have historically made significant buying or selling decisions.
HTF support and resistance zones carry more weight than lower timeframe levels because they represent larger volumes of capital and longer-term market consensus. When price approaches a weekly support level, the reaction is typically more significant than when it approaches a 15-minute level.
ChartsTrack's AI analyzes your HTF chart to identify:
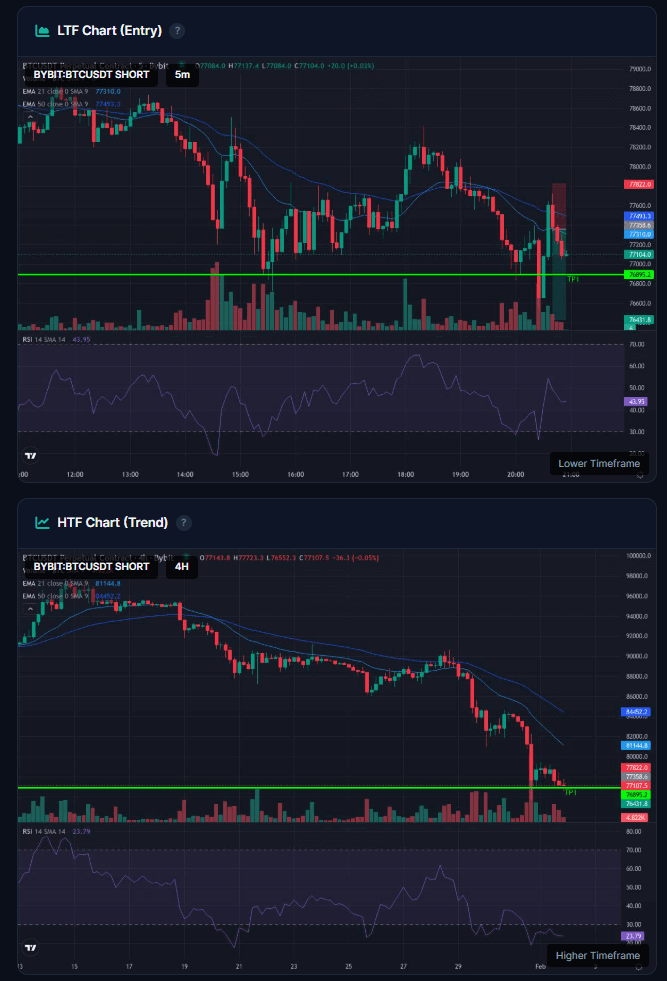
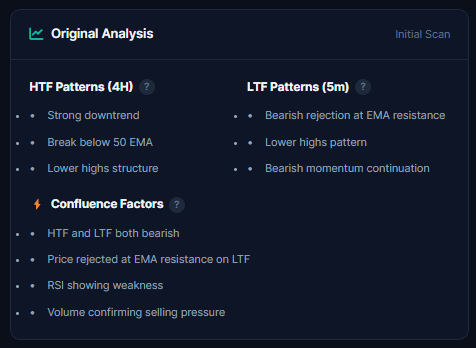
The dual-chart display shows both your HTF and LTF charts side by side with live trade levels overlaid, so you can see exactly how the AI is reading the larger market context while tracking the granular price action.
Support and resistance levels become exponentially more powerful when combined with recognizable chart patterns. A double bottom forming right at a major support zone is far more significant than a double bottom forming in the middle of a range. The confluence of pattern and level creates high-probability trade setups.
ChartsTrack's AI is trained to detect patterns that form at key structural levels across both timeframes. The analysis breakdown shows exactly what the AI sees and how it weighs the evidence:
The AI does not just identify patterns in isolation. It evaluates the context: where the pattern is forming (at a key level or in no-man's land), what the HTF trend says, and whether volume supports the pattern's implications. This contextual awareness is what separates useful pattern detection from noise.
Not all support and resistance levels are created equal. Different types carry different weights and behave differently when tested. Understanding these distinctions helps you prioritize which levels to trade and which to ignore.
These are flat price zones where multiple swing highs or lows have formed over time. The more times price has bounced from a horizontal level, the stronger it becomes. A support zone that has held four times is more reliable than one that has held once. However, be cautious -- every time a level is tested, it weakens slightly. Heavily tested levels eventually break.
Trendlines connect two or more swing lows (ascending support) or swing highs (descending resistance). They represent the pace of a trend. A break of the trendline often signals a trend deceleration or reversal. Trendlines are particularly useful for identifying optimal pullback entry points within an established trend.
Moving averages like the 50 EMA and 200 EMA act as dynamic support and resistance that shift with price. In strong uptrends, price tends to bounce from the 50 EMA on pullbacks. In strong downtrends, price often rejects from the 50 EMA on bounces. The 200 EMA is widely watched as a long-term trend indicator -- price above the 200 EMA is generally considered bullish, and below is bearish.
Fibonacci levels (0.382, 0.5, 0.618, 0.786) within a significant price swing often coincide with support and resistance. The 0.618 (golden ratio) retracement is particularly watched. When a Fibonacci level aligns with a horizontal support/resistance zone, the confluence creates an especially strong level. ChartsTrack's AI recognizes these Fibonacci confluences during chart analysis.
Round numbers like $50,000, $100,000, or $1.00 carry psychological significance. Traders naturally cluster their orders around round numbers, creating real support and resistance even without technical justification. Bitcoin's behavior around major round numbers ($20K, $30K, $50K, $100K) demonstrates this phenomenon clearly. These levels serve as magnets for price and often produce significant reactions.
One of the most common mistakes traders make is identifying support or resistance on a single timeframe and trading it blindly. A level that looks significant on a 5-minute chart may be completely irrelevant on the 4-hour chart. Conversely, a massive weekly resistance zone might not be visible when you are zoomed into a 15-minute chart.
Multi-timeframe confirmation means verifying that a support or resistance level aligns across at least two timeframes before using it as a trade basis. This is the principle that dramatically increases trade quality:
ChartsTrack captures and analyzes both timeframes simultaneously during every chart analysis and monitoring scan. The AI specifically looks for this kind of multi-timeframe confluence, weighting setups higher when HTF and LTF signals align at the same price zone.
Identifying levels is only half the battle. Knowing how to trade them effectively is what generates actual profits. There are three primary strategies for trading support and resistance levels:
The most straightforward approach is buying at support or selling at resistance. When price drops to a proven support zone, you look for a reaction (rejection wick, bullish engulfing candle) and enter long with a stop loss below the zone. Your target is the next resistance level above. The key is patience -- do not front-run the level. Wait for price to actually touch the zone and show a reaction before entering.
When price breaks through a significant support or resistance level with conviction (strong candle close, high volume), it often signals the beginning of a new directional move. Support becomes resistance once broken, and resistance becomes support once broken. Enter in the direction of the break after a confirmed close beyond the level, with your stop loss on the opposite side of the broken level.
False breakouts are some of the highest-probability setups in trading. Price briefly breaks above resistance or below support, trapping breakout traders, then reverses aggressively in the opposite direction. These setups are particularly profitable because the trapped traders add fuel to the reversal as they exit their positions. Look for quick rejections back inside the range after a brief breakout, especially when volume does not support the initial break.
Before entering any trade based on support or resistance, confirm the level on at least two timeframes. An HTF support level with an LTF bullish reaction is far more reliable than an LTF level alone. This simple filter eliminates a significant percentage of losing trades caused by trading weak, single-timeframe levels. ChartsTrack's AI chart analysis does this automatically with every scan.
Three layers of automated support and resistance analysis in every chart scan
The AI identifies major support and resistance zones on your higher timeframe chart, including horizontal levels, EMA interactions, and trendline contacts that define the big-picture structure.
Once HTF zones are identified, the AI analyzes the lower timeframe for price reactions, pattern formations, and momentum shifts that confirm whether the level is likely to hold or break.
Advanced pattern detection identifies double bottoms, head and shoulders, triangles, and other formations at key levels. The confluence of pattern plus level generates higher-confidence trade setups.
Support and resistance levels in crypto are identified by looking for price zones where price has repeatedly bounced or reversed. Key methods include horizontal levels from previous swing highs and lows, trendlines connecting higher lows or lower highs, moving averages (50 EMA, 200 EMA), Fibonacci retracement levels, and round psychological numbers like $50,000 or $100,000. ChartsTrack's AI automatically detects these levels across multiple timeframes during every chart analysis, giving you a comprehensive view of where key price levels sit.
Multi-timeframe analysis is crucial because a support level that appears on a 5-minute chart may be completely insignificant on the 4-hour chart. Higher timeframe levels carry more weight because they represent the decisions of larger market participants over longer periods. When a support or resistance zone appears on both your HTF and LTF charts, it is significantly more likely to hold, giving you higher-probability trade entries with better risk-to-reward ratios.
Waiting for confirmation is generally the safer approach. Instead of placing a limit order right at the support level, wait for price to touch the zone and show a reaction -- such as a bullish engulfing candle, a wick rejection, or a lower timeframe structure shift back in the direction you want to trade. This reduces the risk of catching a falling knife when support fails. ChartsTrack's AI analyzes both the level and the price reaction before generating a trade setup, so you always get confirmation-based entries.
Deepen your understanding of technical analysis and AI-powered trading
ChartsTrack analyzes support, resistance, and chart patterns across multiple timeframes automatically. Upload a chart and get a complete trade setup in seconds.